
research · ai · gtm-operations
Chief of Staff and BizOps Hiring in 2026: Salary, Skills, and What the Job Really Is
Chief of Staff and business operations roles advertise a median of $157,550. They carry the highest rate of explicit decision language of any role measured — 43.7%.
On this page
Chief of Staff and business operations roles advertise a median of $157,550 across 2,359 postings collected between January and July 2026. They are defined less by the tools they name — the median posting names zero — than by what they are asked to produce: 43.7% use explicit decision language, the highest share of any role class measured, and 72% carry reporting-burden language.
This is the synthesis role. It exists to turn scattered information into something a senior person can decide on.
What the role pays
| Measure | Value |
|---|---|
| Median advertised salary | $157,550 |
| 25th percentile | $115,700 |
| 75th percentile | $208,500 |
| Postings with usable salary data | 537 |
| Postings analyzed | 2,359 |
| Advertised as remote | 22% |
Salaries are yearly-equivalent midpoints of the advertised range. Postings in this class that mention AI advertise $170,000 against $147,750 — a 15% premium that clears a rank test (Mann-Whitney z = 4.69).
The most common titles
| Title | Postings |
|---|---|
| Chief of Staff | 383 |
| Business Operations Manager | 156 |
| Business Operations Analyst | 66 |
| Business Operations Lead | 35 |
Chief of Staff alone accounts for 16% of the class — a single title carrying more hiring volume than the entire Service Operations category (317 postings).
The language profile is unlike any other ops role
| Signal | Chief of Staff / BizOps | Revenue Operations |
|---|---|---|
| Decision language | 44% | 46% |
| Reporting burden | 72% | 92% |
| Cross-functional | 81% | 87% |
| Integration pain | 11% | 68% |
| Manual work | 16% | 31% |
| AI language | 33% | 49% |
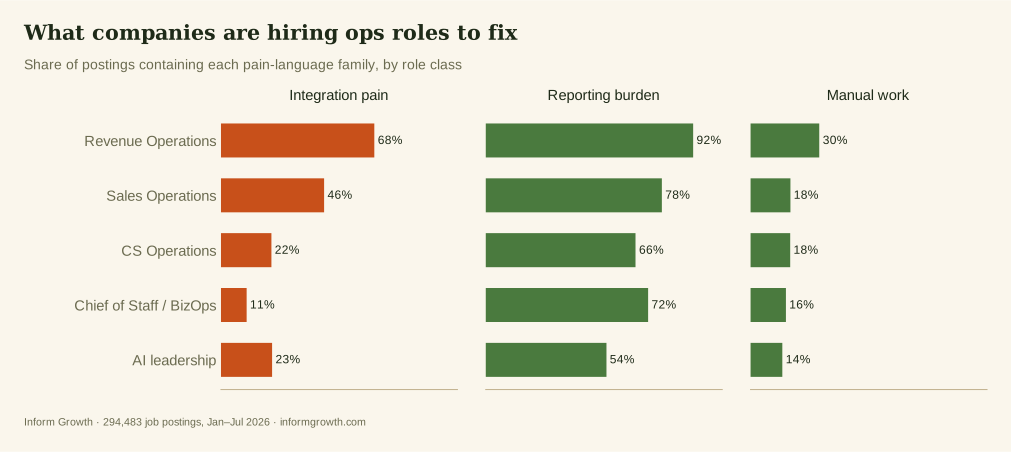
The contrast with RevOps is the point. Both roles are hired to make information usable, but they sit at different ends of the same pipeline. RevOps is asked to connect the systems (68% integration pain). Chief of Staff and BizOps are asked to make sense of what comes out of them (11% integration pain, 72% reporting burden, and the highest decision language of any class).
The tools tell the same story
The median posting names no tool at all, and only 44% name any. When one does appear, it is usually a spreadsheet:
| Tool | Postings | Share of class |
|---|---|---|
| Excel | 571 | 24% |
| Salesforce | 176 | 7% |
| Tableau | 144 | 6% |
| Power BI | 134 | 6% |
| Claude | 98 | 4% |
| Google Sheets | 74 | 3% |
| Notion | 68 | 3% |
Claude appearing in 4% of Chief of Staff postings is worth noting on its own — the AI assistant is now named more often in this role than Google Sheets.
What companies are actually buying
Strip the title away and the postings describe three kinds of work: find the information wherever it lives, consume it — reconcile it, compress it into a deck or a dashboard — and create the output that turns a decision into work. The pain language measures the cost of each: integration pain is the cost of finding, reporting burden the cost of consuming, manual work the cost of creating.
For Chief of Staff and BizOps, the cost concentrates in the middle. That is what a 72% reporting burden alongside a 44% decision-language rate means: the bottleneck is not headcount and it is not intelligence, it is decision throughput — and companies buy it the only way the market currently sells it, one salaried human at a time.
How this was measured
These figures come from Inform Growth's 2026 study of 294,483 job postings, collected from public job boards between January 4 and July 26, 2026, with a collection pause in April and May. This role class covers Chief of Staff, BizOps Manager, and Business Operations titles. Phrase-family statistics use pattern matching over full description text. Text analysis covers postings with English descriptions of at least 300 characters.
Read the full research: What 294,483 Job Postings Reveal About AI and Operations Hiring in 2026
Related: Does mentioning AI raise advertised salary? · The RevOps tech stack · Excel is still the integration layer
Inform Growth builds and runs managed AI infrastructure for teams whose decision throughput is capped by how long it takes to find and reconcile the information. Start here.
Frequently asked questions
What does a Chief of Staff earn in 2026?
Chief of Staff and business operations roles advertise a median of $157,550 as a yearly-equivalent midpoint, with a 25th-to-75th percentile range of $115,700 to $208,500.
What does a Chief of Staff actually do?
On the evidence of 2,359 job postings, the role is defined by synthesis rather than systems: 44% use explicit decision language — the highest of any role class — and 72% carry reporting-burden language, while only 11% mention integration pain.
What tools do Chief of Staff roles require?
Usually none. The median posting names zero tools and only 44% name any. When one appears it is most often Excel, in 24% of postings.